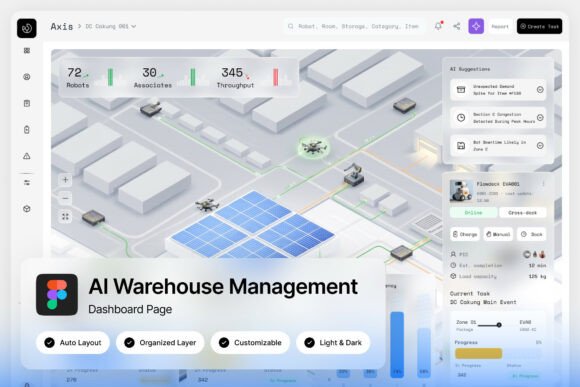
Axis: Where Spatial Intelligence Meets Warehouse Operations
Imagine walking into a warehouse where every shelf, every pallet, and every shipment is visible from a single glance—not through a cluttered spreadsheet, but through a clean, three-dimensional map that feels almost alive. That's the core idea behind Axis AI Warehouse Management Dashboard, a modern UI design that transforms complex logistics data into an intuitive visual experience. For designers, product teams, and entrepreneurs working in supply chain tech, this isn't just another admin template; it's a thoughtfully crafted tool that bridges the gap between raw operational metrics and spatial understanding.
A Visual Language Built for Clarity and Action
What immediately stands out about Axis is its isometric 3D warehouse map. Instead of abstract numbers, you see a representation of your actual storage space—aisles, racks, zones—rendered in a soft, light blue-and-white color scheme that feels both professional and approachable. This isn't just decorative; it serves a functional purpose. When inventory levels shift or a shipment gets delayed, the spatial layout provides instant context. You don't just see that stock is low; you see where it's low, which aisle is affected, and how it relates to incoming shipments.
The dashboard pairs this spatial view with dedicated panels for inventory tracking and shipment status cards. Each element is designed to reduce cognitive load. Metrics like order fulfillment rates, warehouse capacity, and logistics performance are presented in clean charts and cards that don't overwhelm. For product teams building smart warehouse platforms, this approach demonstrates how thoughtful UI design can make data actionable rather than just visible.
From Logistics Tech to Everyday Design Inspiration
While Axis is built for warehouse management, its design principles offer valuable lessons for anyone working on visual communication. The clean typography, consistent iconography, and restrained color palette are hallmarks of modern branding. If you're designing a logo for a tech startup, creating packaging for a product line, or laying out a magazine spread, the same rules apply: clarity, hierarchy, and visual consistency matter.
Consider how the dashboard's font choices—likely clean sans-serifs from Google Fonts—prioritize readability at a glance. That's exactly what you need for social media graphics where users scroll quickly, or for website headers that must communicate value in seconds. The organized, named layers in the Figma file make customization straightforward, whether you're adapting the color scheme to match a brand identity or reworking layouts for a different industry.
Practical Applications Beyond the Warehouse
Let's think about how the visual language of Axis translates to other creative projects:
- Brand Identity Systems: The dashboard's cohesive style—consistent spacing, aligned elements, balanced whitespace—mirrors what makes a strong brand identity. Use similar principles when developing logo suites, business cards, or style guides.
- Packaging Design: The light, airy color scheme works beautifully for products that want to convey cleanliness, efficiency, or technological sophistication. Think health foods, software subscriptions, or minimalist home goods.
- Digital Products and Apps: The card-based layout for shipment statuses is a pattern you'll find in project management tools, fitness apps, and e-commerce platforms. Studying how Axis organizes information can help you design better user interfaces.
- Marketing Assets: The metrics panels demonstrate effective data visualization—turning numbers into stories. Apply similar techniques to infographics, annual reports, or social media content that needs to explain complex information simply.
- Editorial Layouts and Blogs: The clean hierarchy and readable typography are essential for long-form content. Whether you're designing a blog template or a print magazine, prioritizing readability keeps audiences engaged.
Even hobbyists creating invitations or merchandise can learn from this approach. The key is understanding that good design isn't about complexity; it's about making intentional choices that serve the user's needs—whether that user is a warehouse manager checking inventory or a customer browsing an online store.
Making It Work for Your Projects
If you're considering Axis as a design asset, think about how its strengths align with your goals. The pixel-perfect layout at 1440×1024 resolution is ideal for desktop-first applications, but the clean design scales well. The inclusion of both light and dark mode interfaces is particularly useful—dark modes are increasingly popular for digital products, reducing eye strain in low-light environments, while light modes often feel more approachable for general audiences.
For those working on branding or commercial projects, pay attention to the font links included. Testing font pairings is crucial. A bold sans-serif might work for headlines, but you'll want something more legible for body text. The Google Fonts included are free for commercial use, which simplifies licensing concerns—always a relief for small businesses and startups watching their budgets.
When customizing, maintain the original design's visual consistency. Change colors to match your brand, but keep the spacing and alignment intact. Swap out placeholder text with your own content, but preserve the hierarchy that guides the eye. The well-organized layers make this easier, but it still requires a designer's eye to ensure the final product feels cohesive.
The Bigger Picture: Design as a Strategic Tool
Axis AI Warehouse Management Dashboard ultimately reminds us that great design solves problems. It's not about making things look pretty—it's about making information accessible, decisions clearer, and workflows more efficient. Whether you're building a supply chain platform, designing marketing materials for a logistics company, or creating a visual identity for a tech startup, the same principles apply: understand your audience, prioritize clarity, and build systems that scale.
For creative professionals and entrepreneurs, resources like this are more than just templates—they're case studies in effective visual communication. By studying how Axis balances spatial visualization with operational data, you can bring similar clarity to your own projects, no matter how different the context. After all, whether you're tracking shipments or crafting a brand story, the goal is the same: to communicate the right information, to the right people, in the right way.